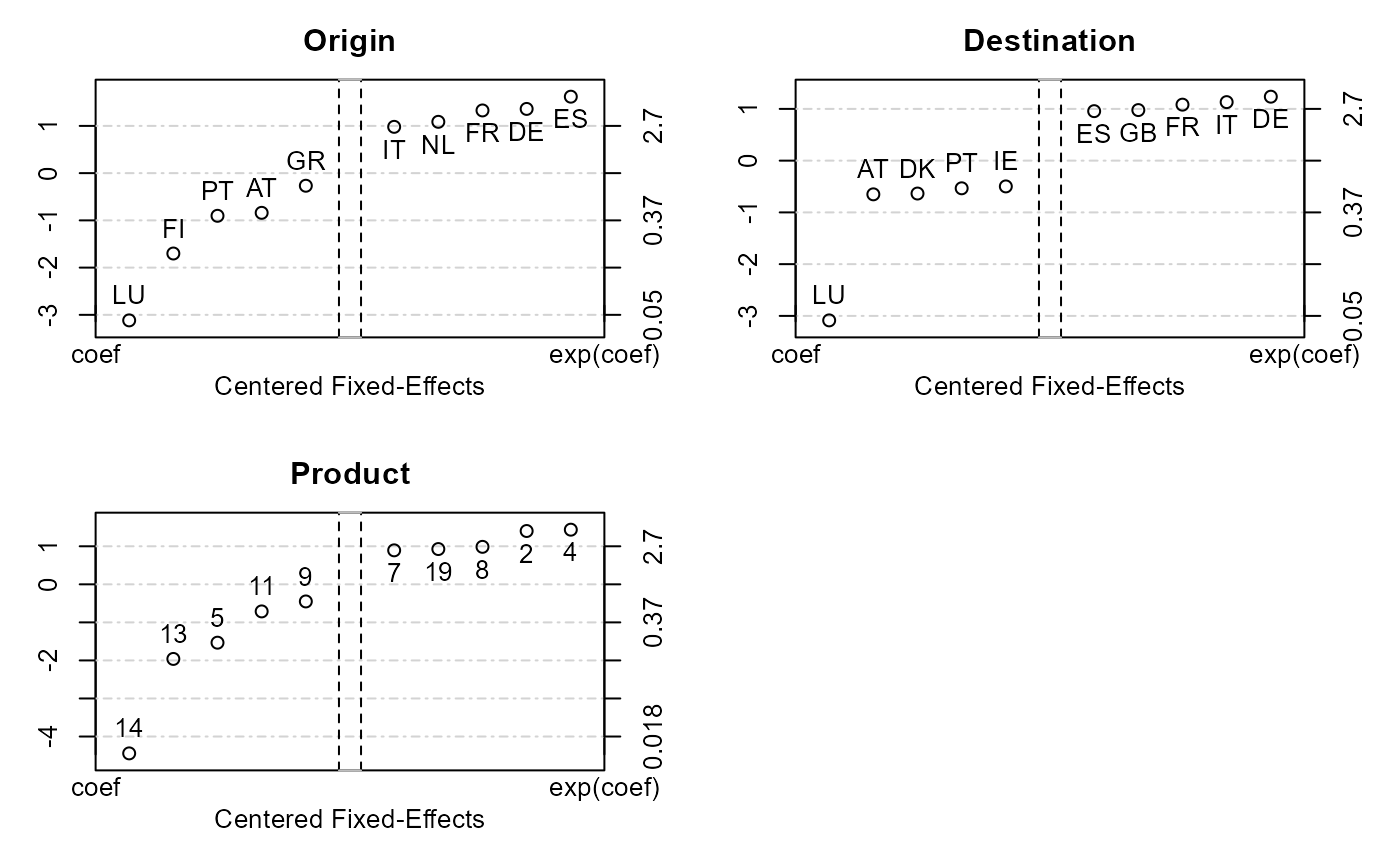
This function plots the 5 fixed-effects with the highest and lowest values, for
each of the fixed-effect dimension. It takes as an argument the fixed-effects obtained
from the function fixef.fixest after an estimation using femlm, feols or feglm.
Usage
# S3 method for class 'fixest.fixef'
plot(x, n = 5, ...)
Arguments
- x
An object obtained from the function
fixef.fixest.- n
The number of fixed-effects to be drawn. Defaults to 5.
- ...
Not currently used.
Note that the fixed-effect coefficients might NOT be interpretable. This function is useful only for fully regular panels.
If the data are not regular in the fixed-effect coefficients, this means that several ‘reference points’ are set to obtain the fixed-effects, thereby impeding their interpretation. In this case a warning is raised.
See also
fixef.fixest to extract clouster coefficients. See also the main
estimation function femlm, feols or feglm. Use summary.fixest to see
the results with the appropriate standard-errors, the function etable to
visualize the results of multiple estimations.